Design with live data
Yet, I’m not only about being a designer… there’s more to this story. Try smartphones, gadgets & gizmos, all summed up in the much used, yet very relevant in this case, phrase “tech enthusiast”.
Now as a designer, creating a personal page is not a simple project. Having created so many designs for so many different clients, you get lost in what features, colors & shapes really build your personal melody. They become blurred with all the rest.
My desire to create my personal website, caused me to stop & reflect. Everyone is a combination of different backgrounds, values, experiences & aspiration creating a unique personality. I want to share bits & bites of my personality with you via my work & my website. That’s why the design I chose to represent me does not only include small & sexy animations, the design includes me. Your experience on my website is connected with my heart rate. It’s not only about ready about me & my work, it’s about understanding the motives & psyche that have created that piece of work.
Designing for Live Data
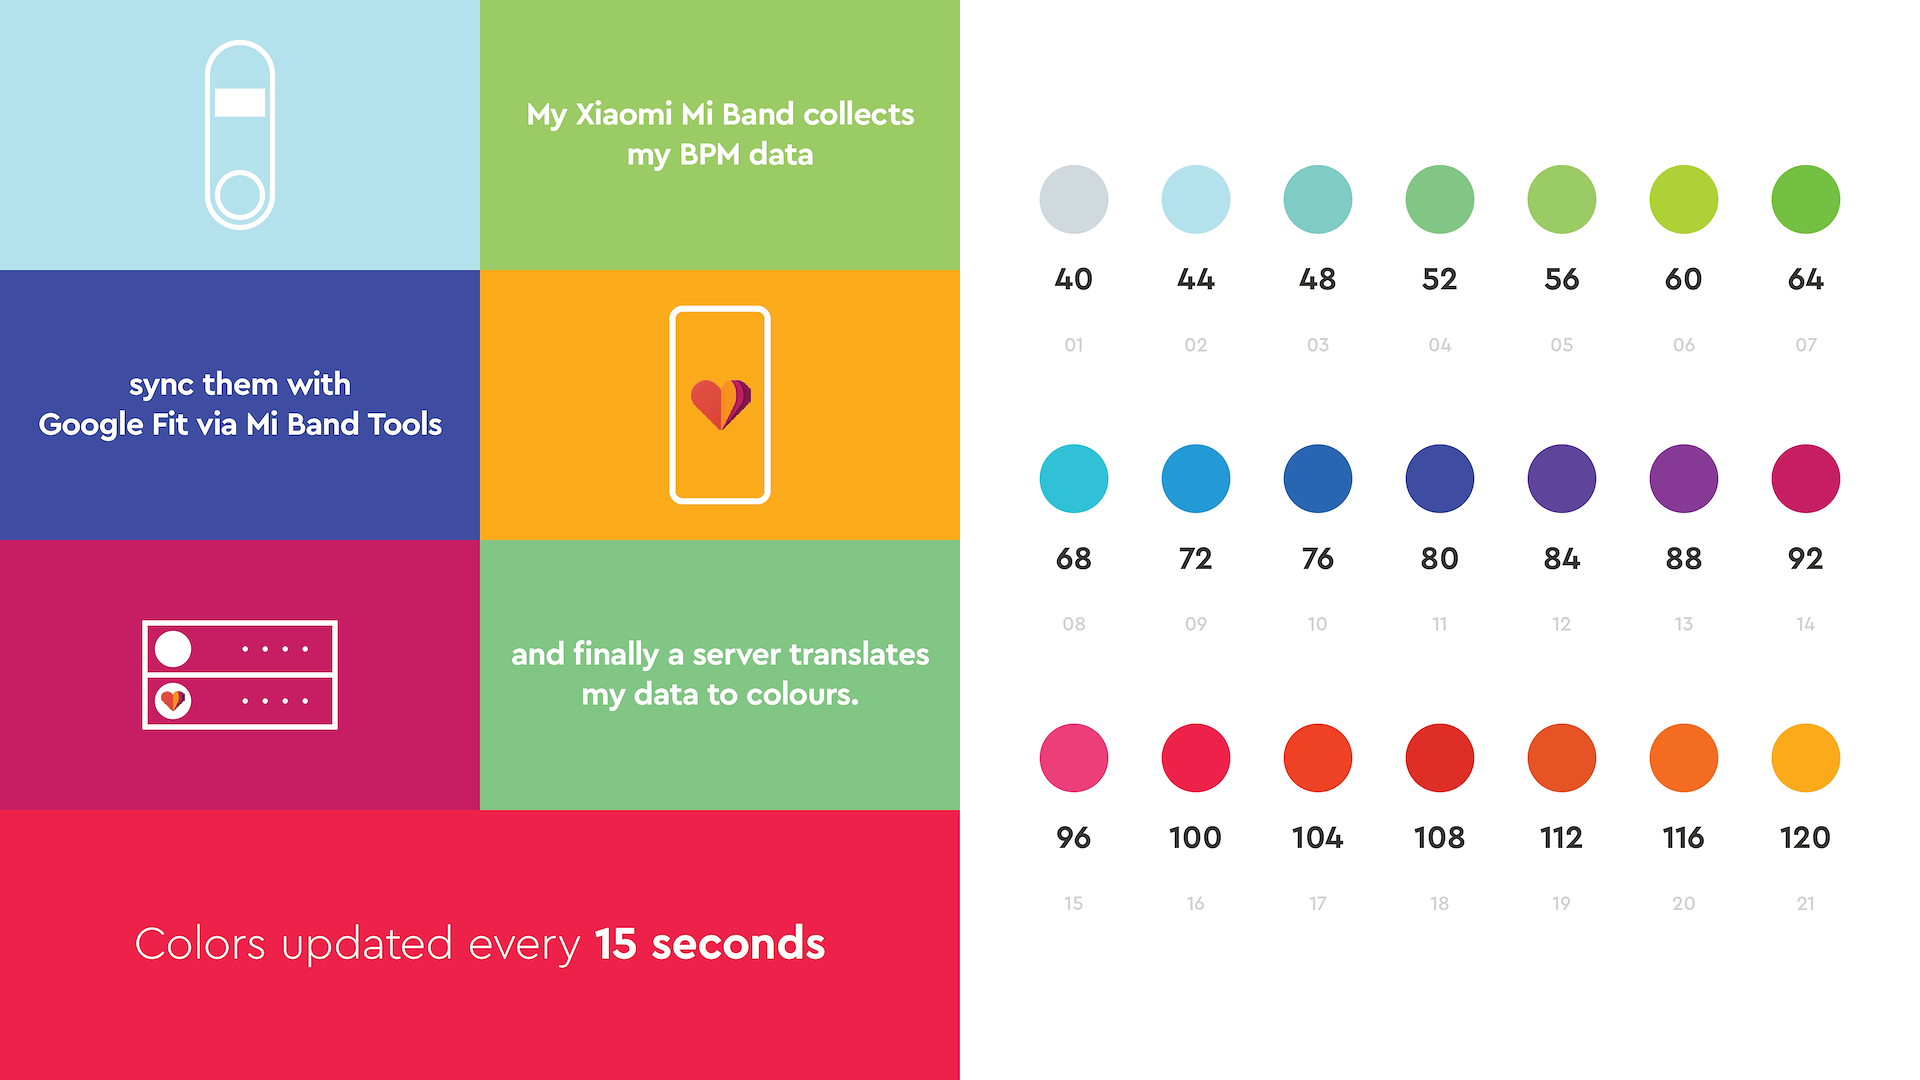
The first step to start is to explore and devide the measurement according to minimum and maximum rates. So, I devided the measuremnt from 0 to 220 BPM per 20. Every 20 BPM the color is changing. I create a gradient with 11 colors for every 20 BPM. These colors are chaging with a gradient, updated per minute.
The second part written by Gerry Athanasopoulos
and explaining the backend process.
In order to get the data in realtime from the Xiaomi MiBand 2 we integrated a mobile app, called MiBand Tools, with the band that syncs the data to GoogleFit in regular intervals. As with every service, Google provides a REST API for querying stored data to GoogleFit. So, the game plan is the following: at regular intervals (~ 15sec) the client makes an API call to our server and the server queries the GoogleFit API in order to get the most recent BPM (beats per minute) that MiBand Tools has synced. The server then replies back to the client with the current BPM and the client updates the DOM. The DOM effects of the BPM-change are mostly color-wise. Colors on specific regions of the page are changed according to the BPM value; same BPM values produce the same color transition effects. Now to the implementation details!
Google uses OAuth 2.0 for their private APIs (those APIs that have to do with personal user data) so in order for the server to be able to query the GoogleFit API on behalf of the user we need two things:
1. Register our server as an application at Google
For this we go to Google API console and create an application that we will call BPMApp and enable GoogleFit. Google provides us with a client ID and a client secret for our BPMApp.
2. Get users’ consent that our server will query his personal data at GoogleFit.
Now this is a little bit trickier. Getting users’ consent means that we have to obtain an access token that the server will use to make API calls against GoogleFit. The only way to obtain this access token is to create a URL that the user should visit and give permission to BPMApp to access his data. This URL is called an authentication URL and it is pretty easy to generate.